|
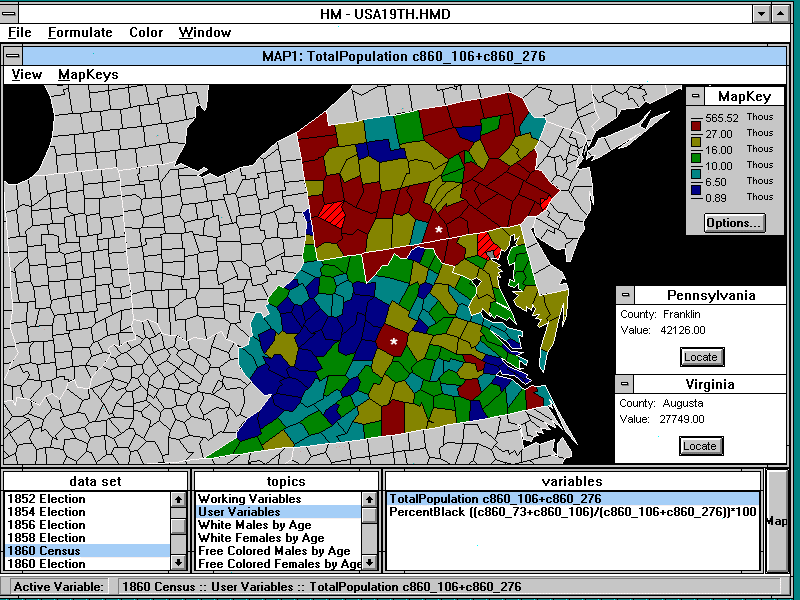
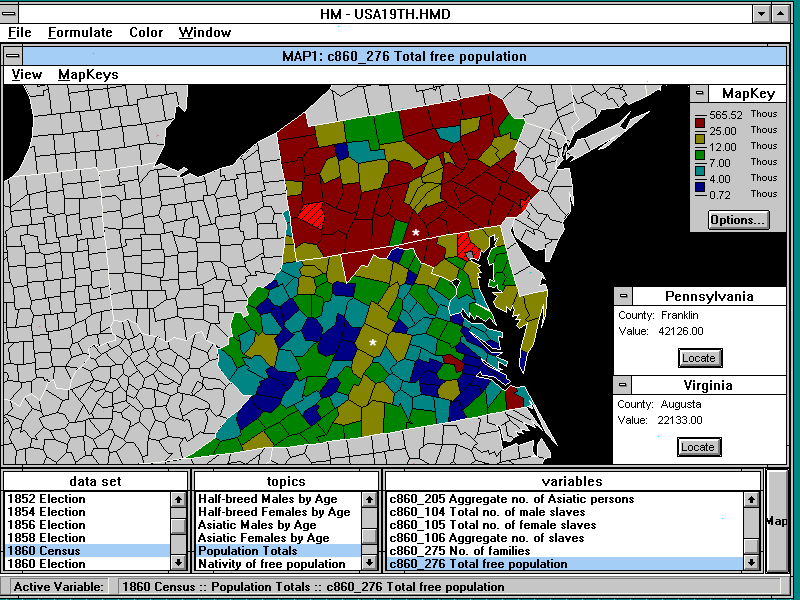
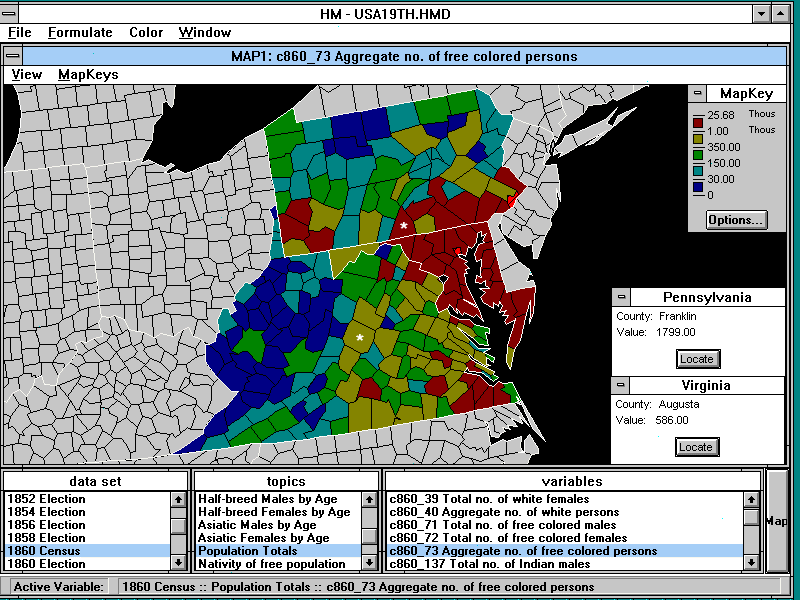
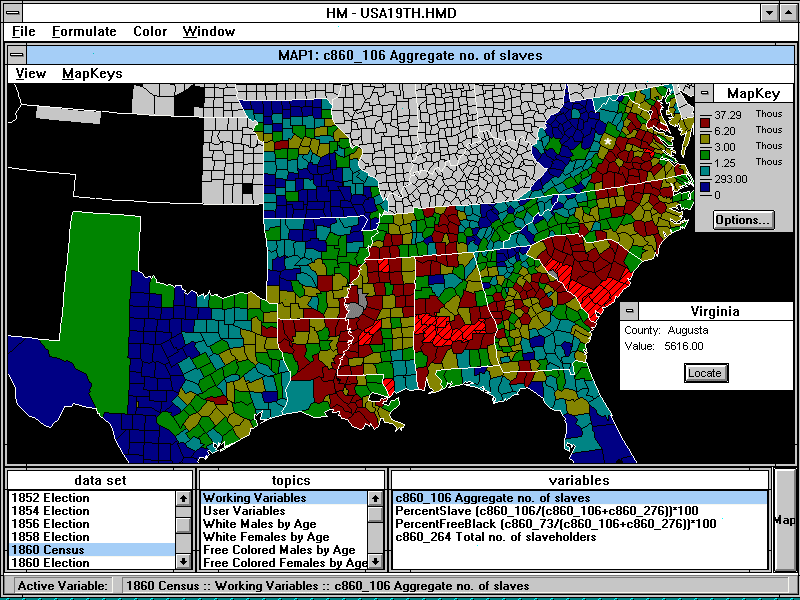
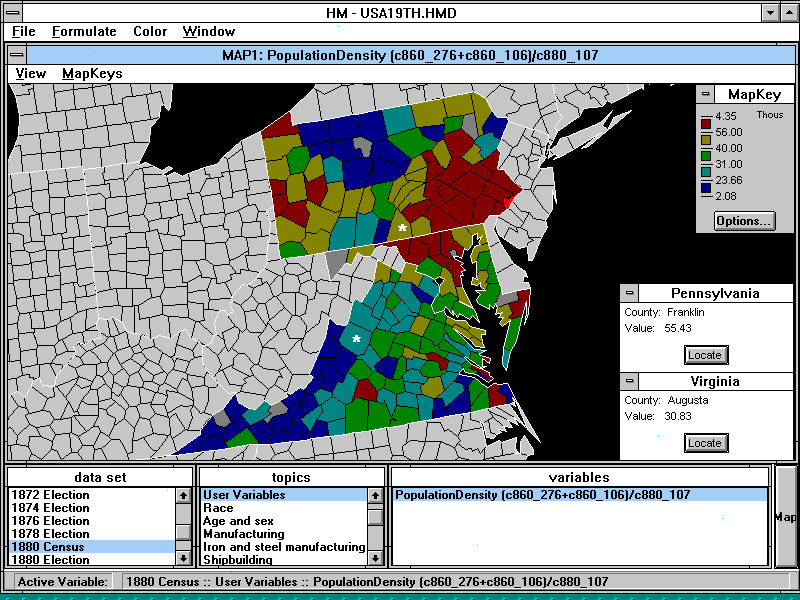
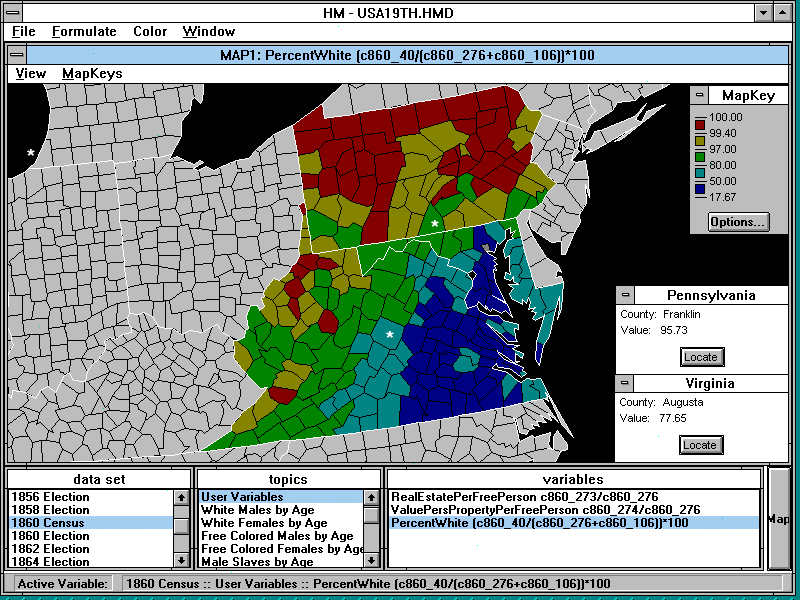
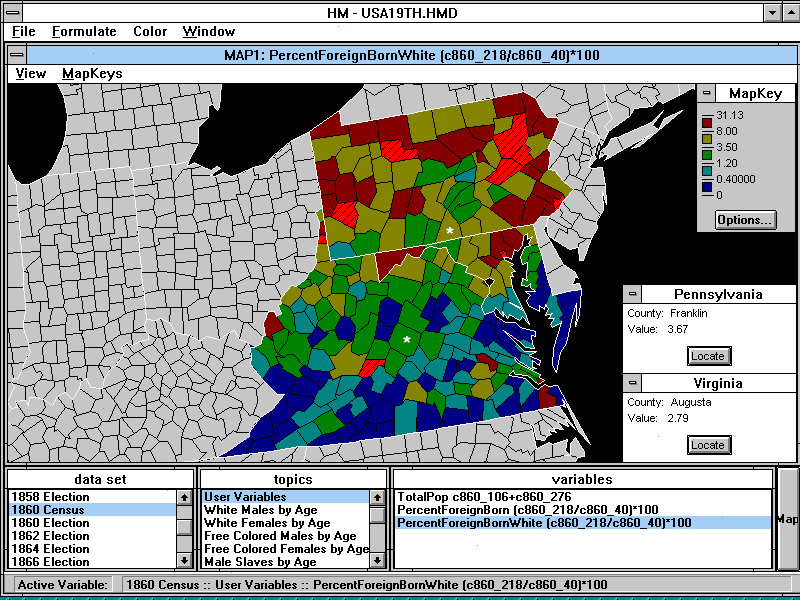
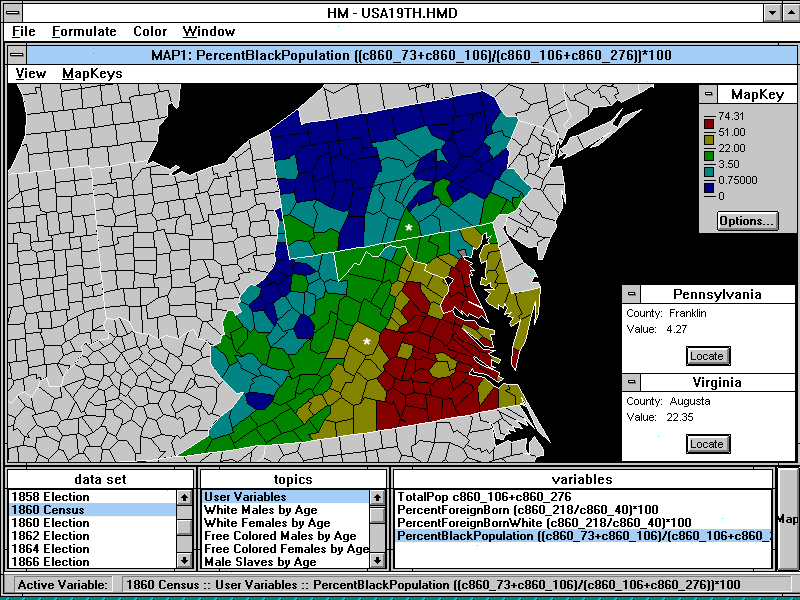
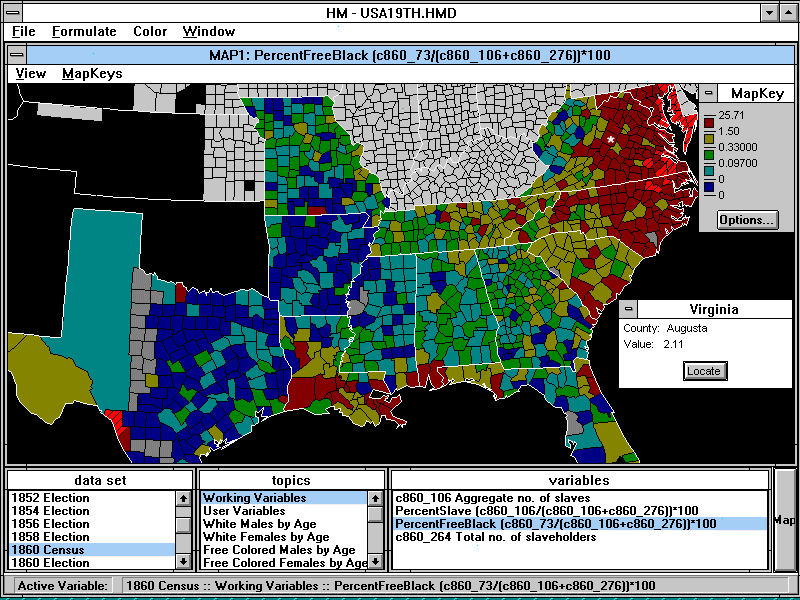
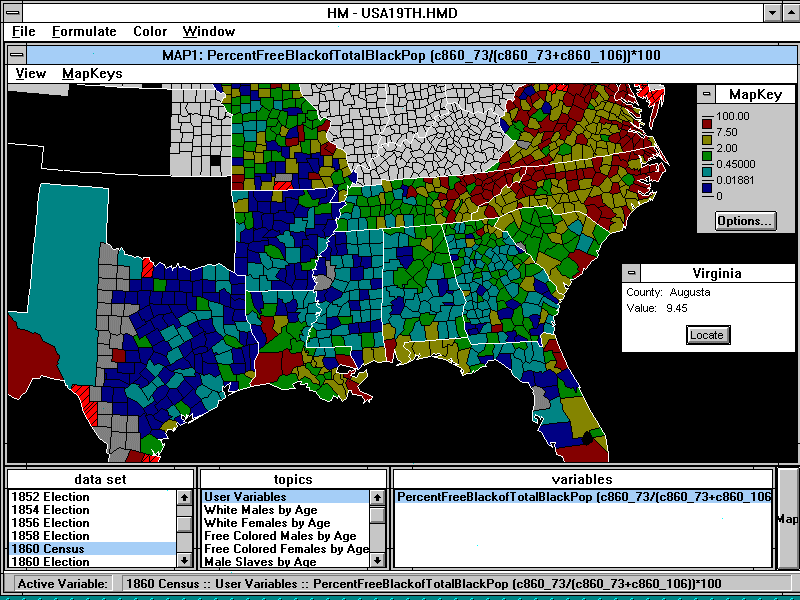
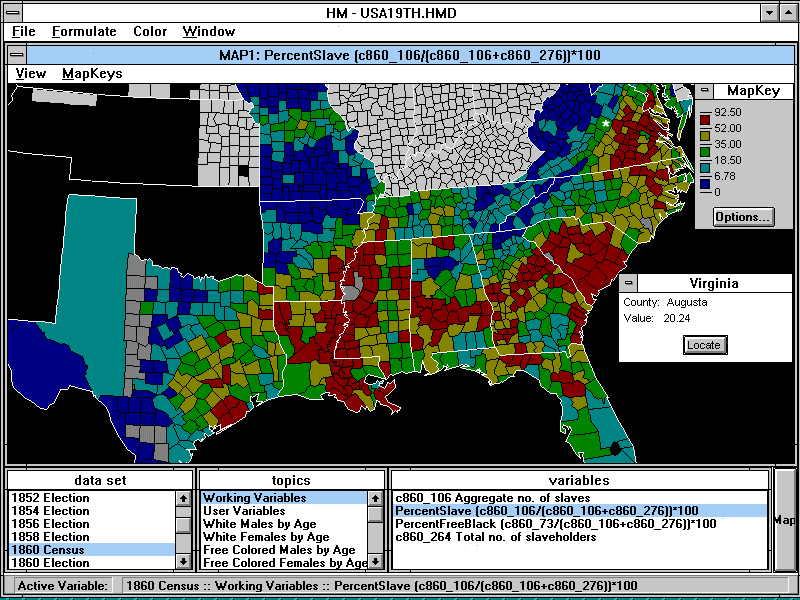
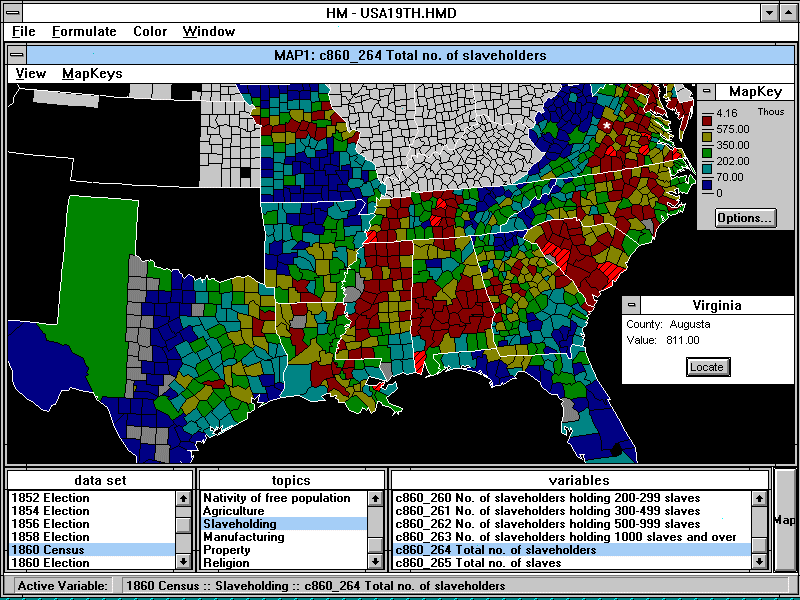
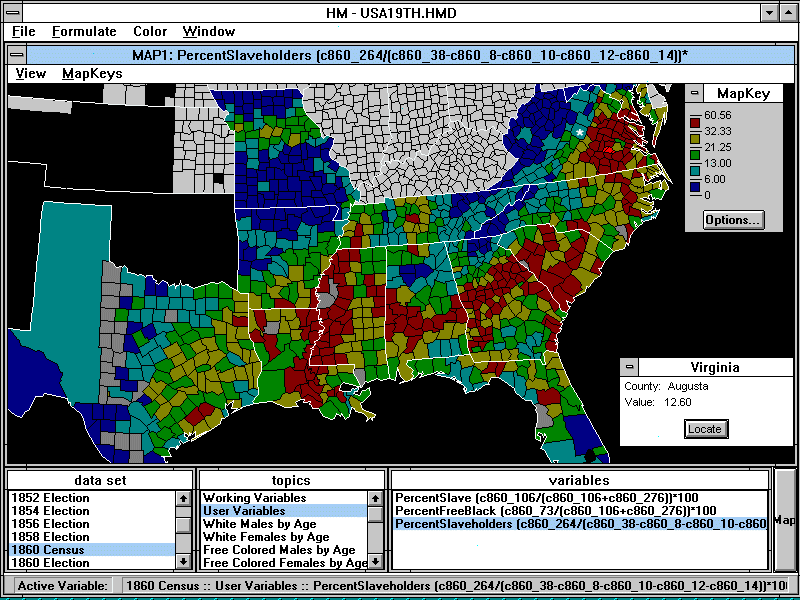
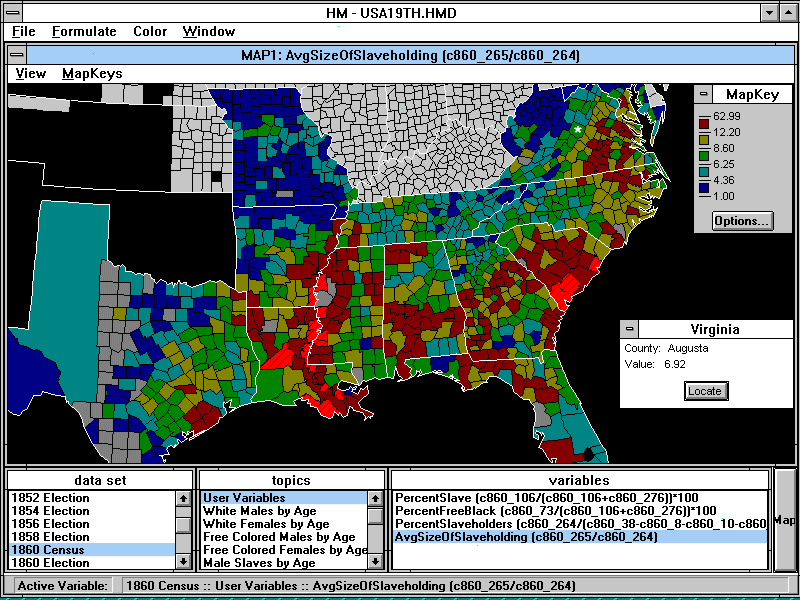
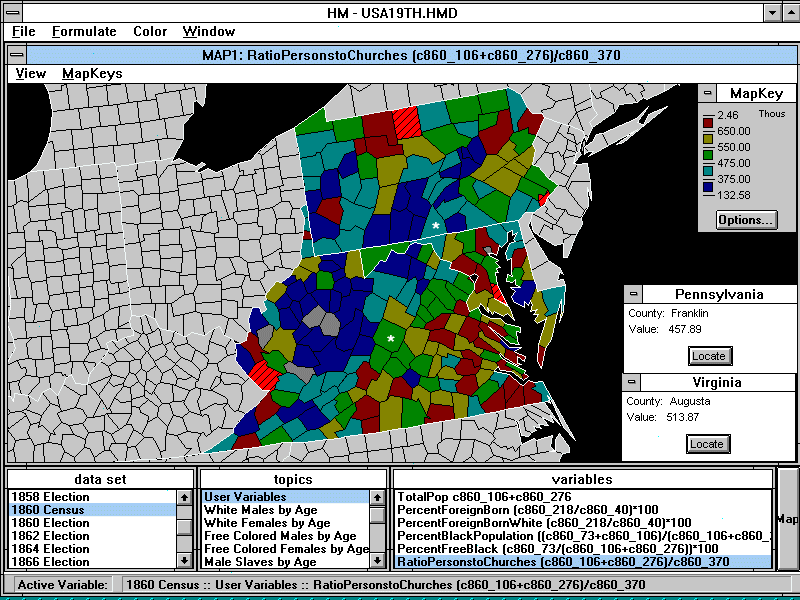
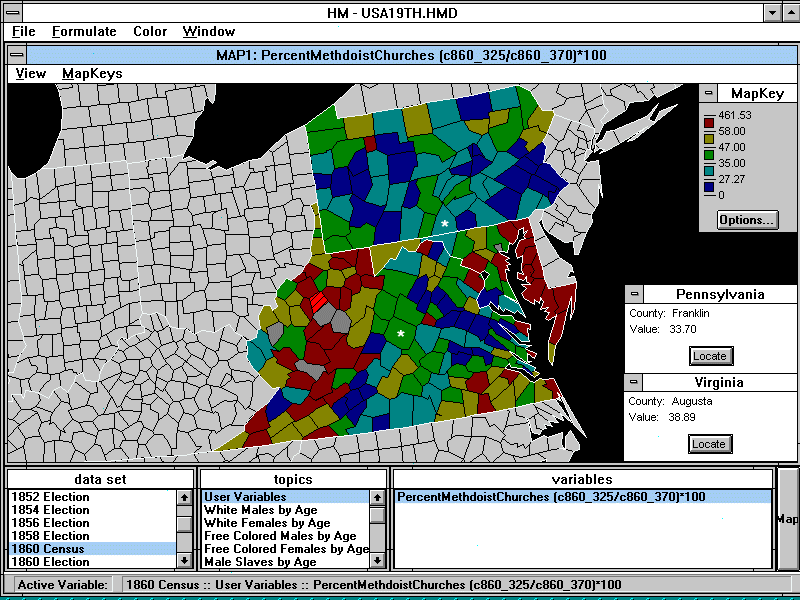
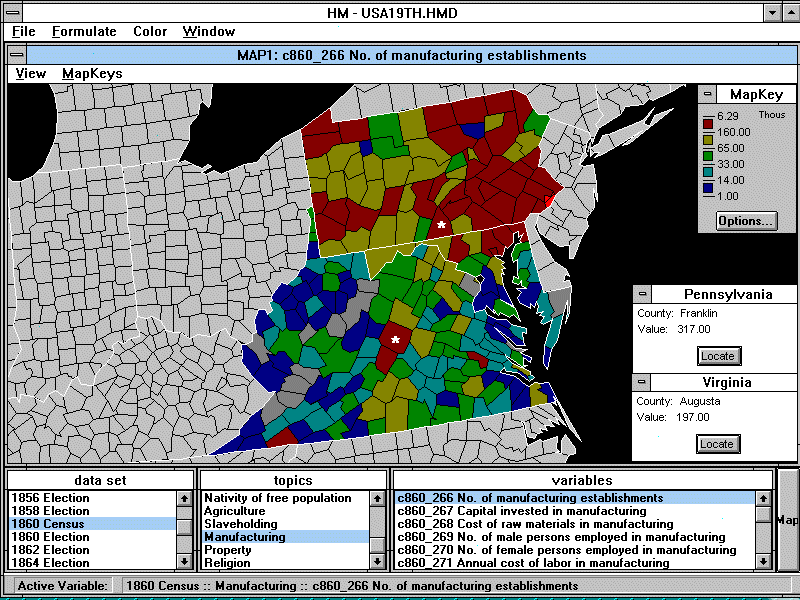
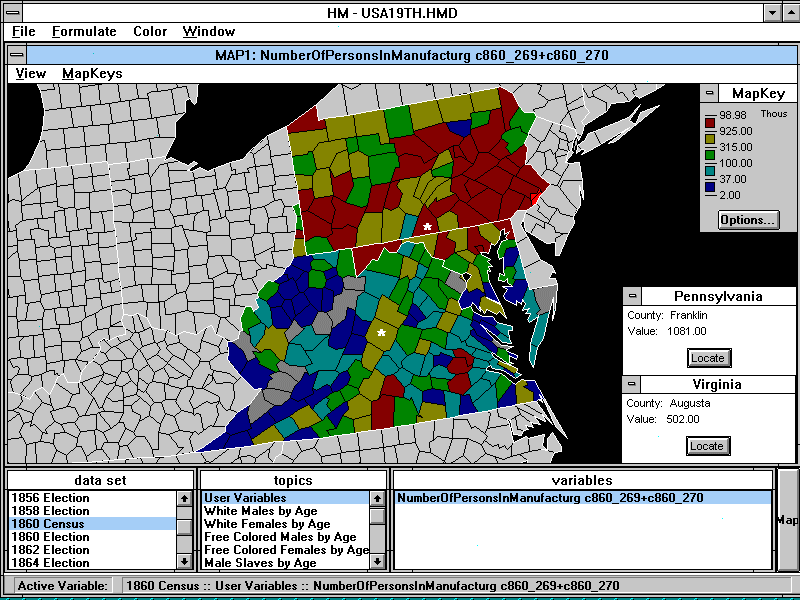
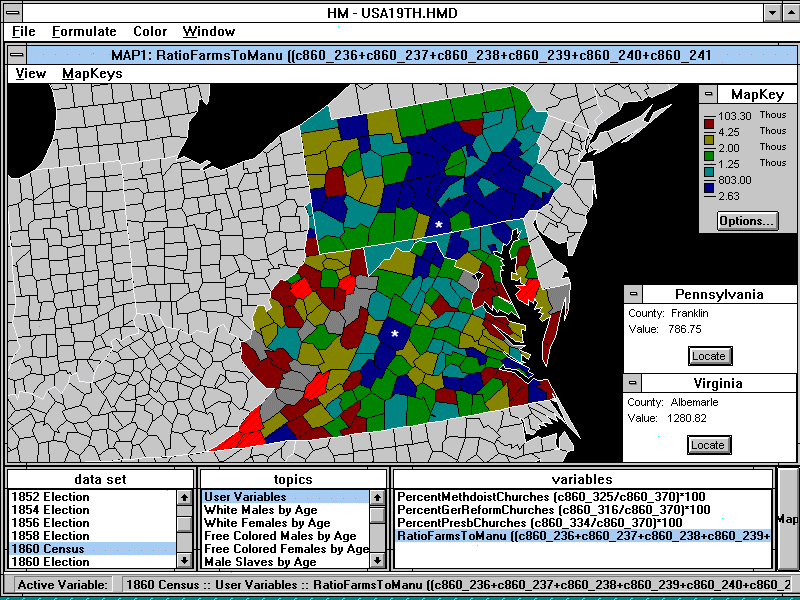
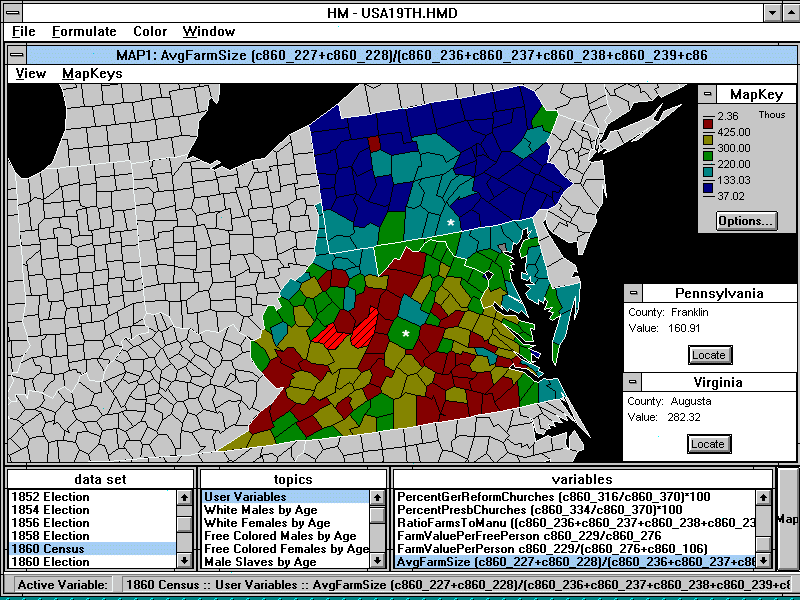
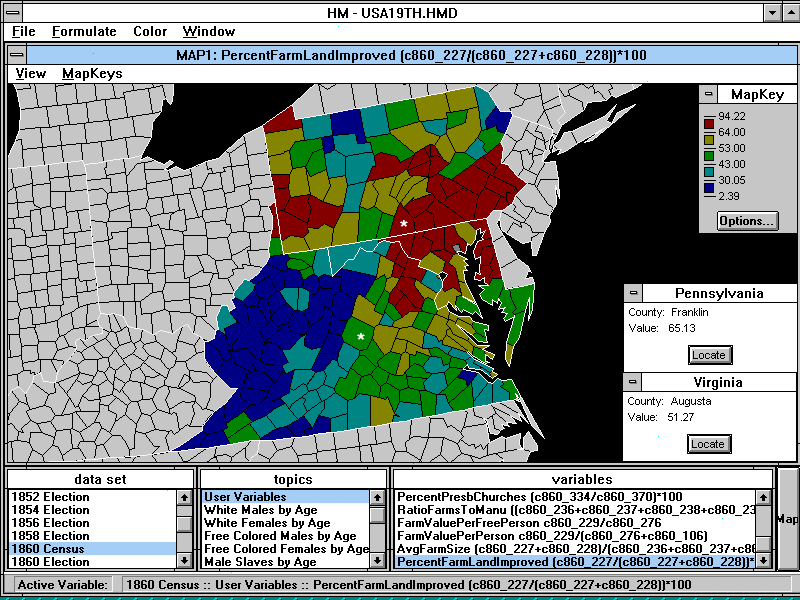
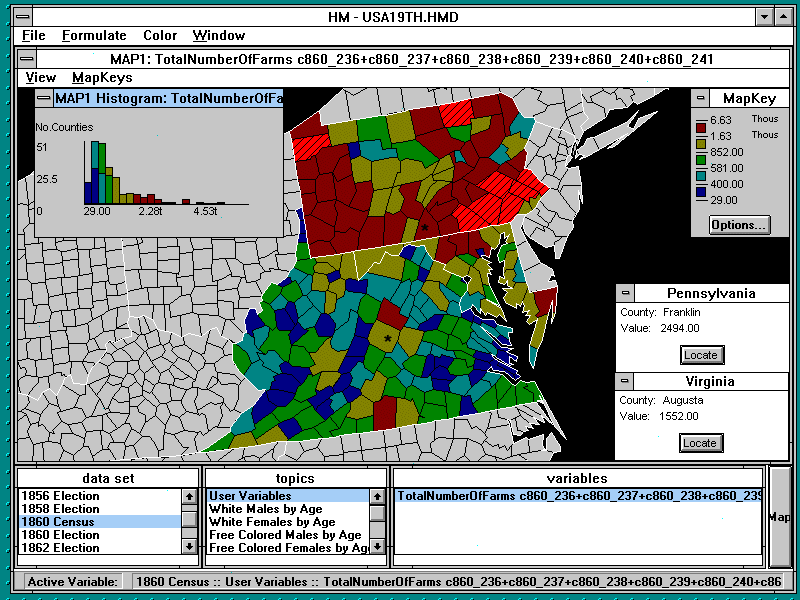
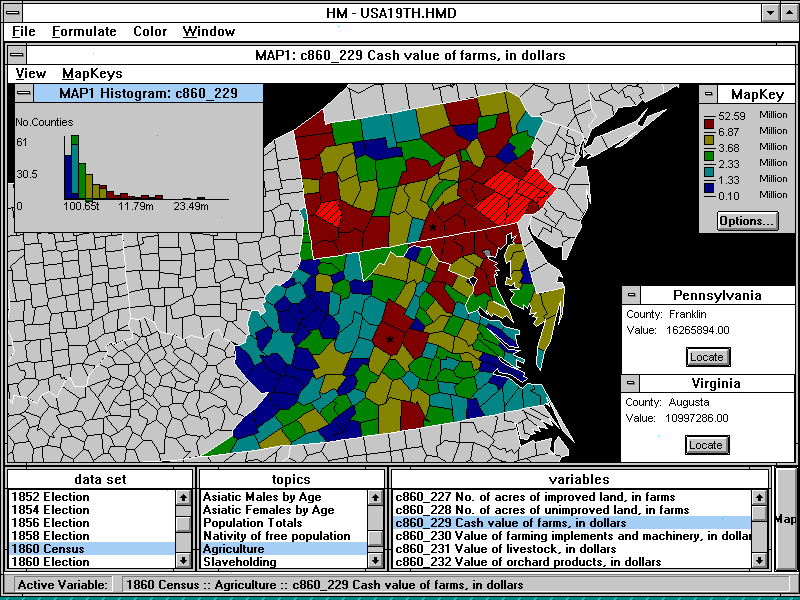
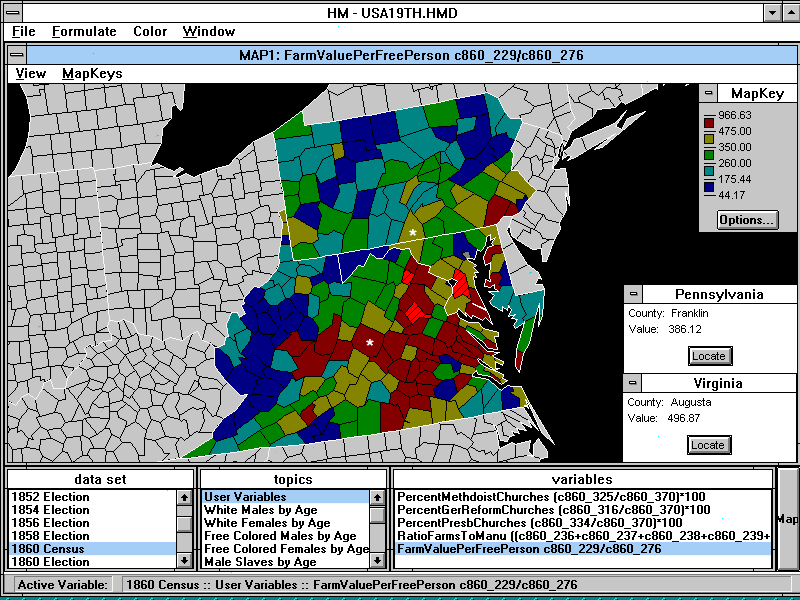
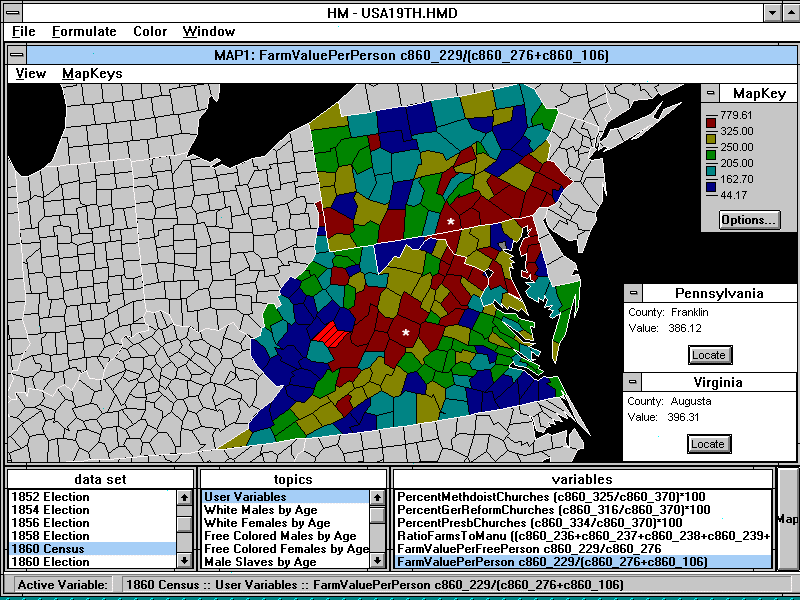
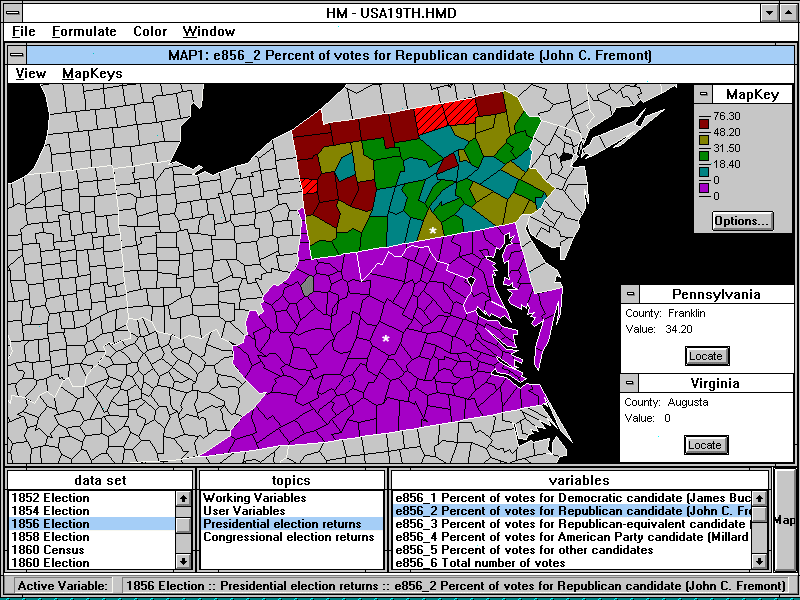
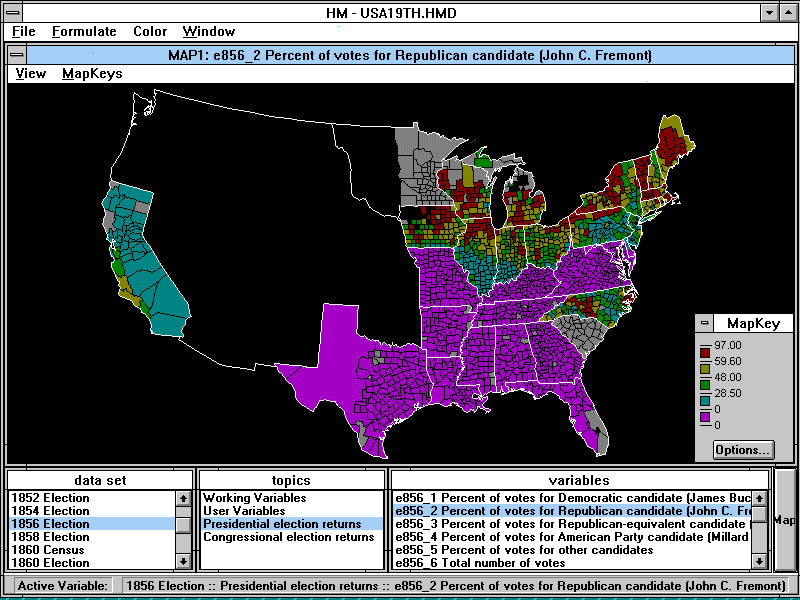
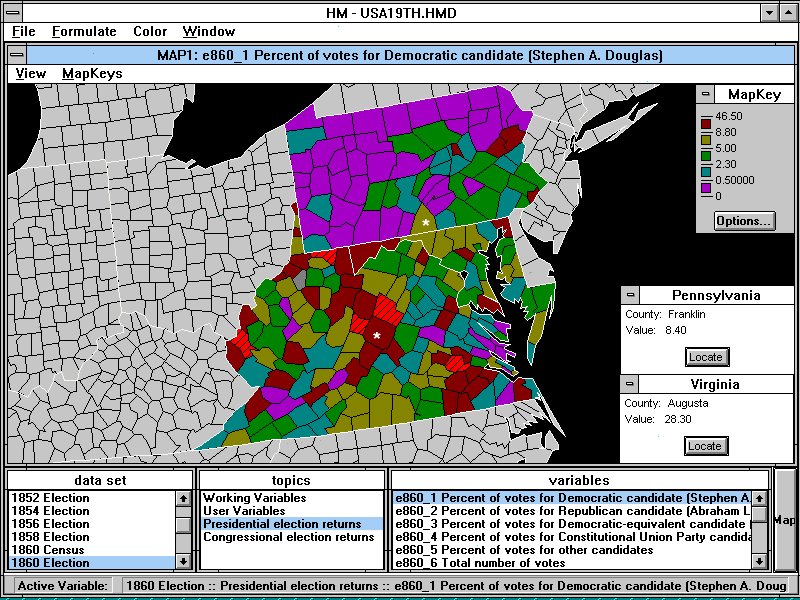
Drawing on national election returns and data found in the decennial federal census, these maps set Augusta and Franklin Counties in the context of their respective states, the Mid-Atlantic region, and the North and the South. They also allow for direct comparisons between the two counties. The maps are based on a broad range of demographic and economic characteristics, including population size, racial composition of the population, religious affiliation, agricultural output, and manufacturing production. Each map is unique, displaying the results for one variable. Asterisks mark Augusta and Franklin Counties, and each map is divided into five roughly equal parts, or quintiles, indicated by color. The map key shows the cutoff points for the different colors used on the map. The distribution of the variables on each map is based only on data for the area mapped and not for the nation as a whole. In other words, maps of the Mid-Atlantic region are based on data for the Mid-Atlantic region only (Pennsylvania, Virginia, and Maryland), and maps of the North and the South are based solely on data for those regions of the country.
These comparative maps are based on maps generated by the Great American History Machine, developed by Professor David W. Miller of Carnegie Mellon University. Currently, the Great American History Machine is maintained by the
Academic Software Development Group at the University of Maryland at College Park, under the direction of Dr. Chad K. McDaniel. The Great American History Machine, which permits the interactive mapping of an enormous array of county-level data from 1790 to the present, is now available on CD-ROM from the University of Maryland at College Park.
Population
- Total Population, 1860
- Total Free Population, 1860
- Total Free Black Population, 1860
- Total Number of Slaves, 1860
- Population Density, 1860(Total Population Divided by Total Area in Square Miles)(Note: total area data comes from 1880 census, the first census to provide this information)
- Number of Whites as Percentage of Total Population, 1860
- Number of Foreign Born White Persons as Percentage of Total White Population, 1860
- Number of Black Persons as Percentage of Total Population, 1860
- Number of Free Black Persons as Percentage of Total Population, 1860
- Number of Free Black Persons as Percentage of Total Population in the Southern States, 1860
- Number of Free Black Persons as Percentage of Total Black Population in the Southern States, 1860
- Number of Slaves as Percentage of Total Population, 1860
- Total Number of Slaveholders, 1860
- Number of Slaveholders as Percentage of Number of Adult White Males (15 years and older), 1860
- Average Size of Slaveholdings, 1860
- Ratio of Total Number of Persons to Total Number of Churches, 1860
- Number of Methodist Churches as Percentage of Total Number of Churches, 1860
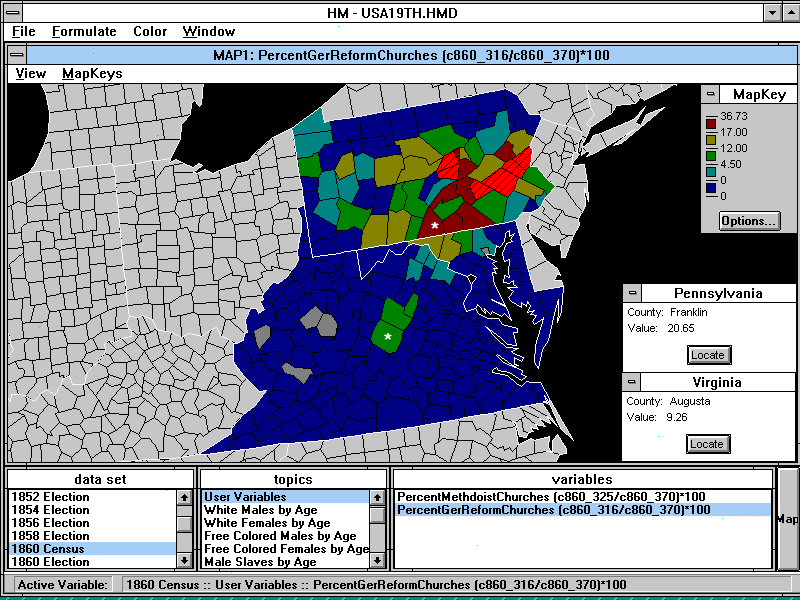
- Number of German Reformed Churches as Percentage of Total Number of Churches, 1860
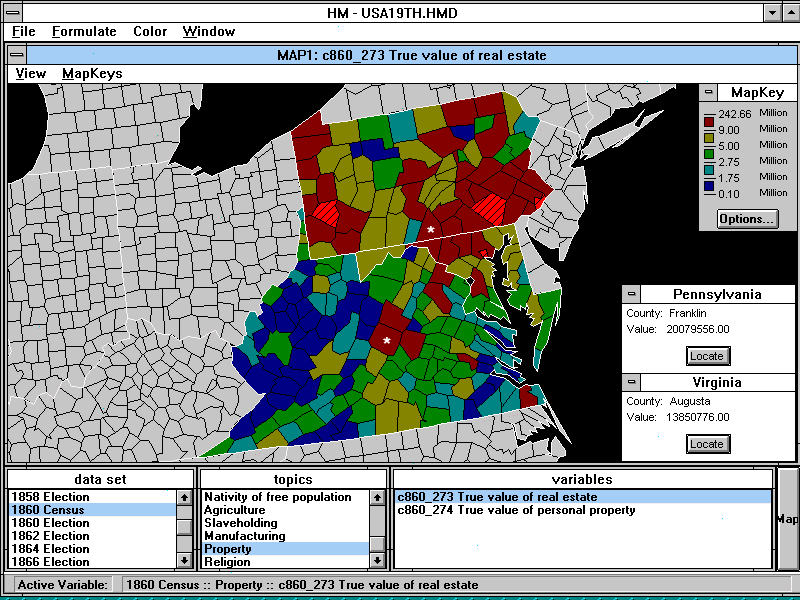
- Total Value of Real Estate, 1860
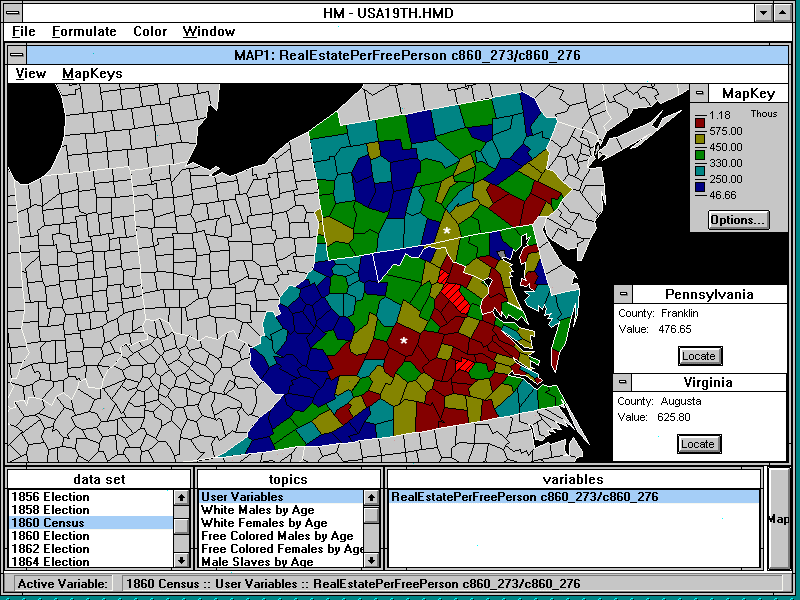
- Value of Real Estate Per Free Person, 1860
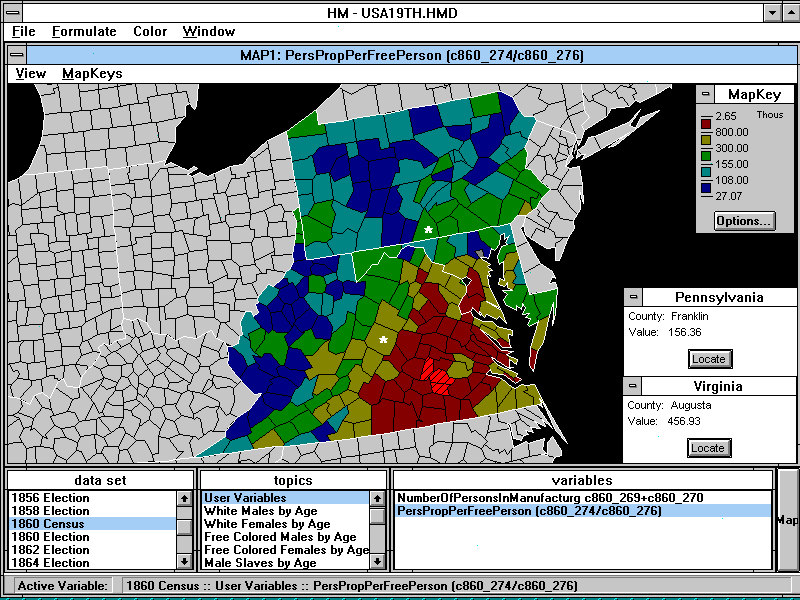
- Value of Personal Property Per Free Person, 1860
Economy
- Number of Manufacturing Establishments, 1860
- Total Number of Persons Employed in Manufacturing Establishments, 1860
- Ratio of the Number of Farms to the Number of Manufacturing Establishments, 1860
- Average Farm Size (acres of improved and unimproved lands), 1860
- Number of Acres of Improved Farm Land, as Percentage of Total Number Acres of Improved and Unimproved Farm Land, 1860
- Total Number of Farms, 1860
- Cash Value of Farms, 1860
- Cash Value of Farms Per Free Person, 1860
- Cash Value of Farms Per Person (free and slave), 1860
Electoral
- 1852 Presidential Election, Winning Candidates, by County, Mid-Atlantic Region (Pierce [Democratic]=purple; Scott [Whig]=aqua)
- 1852 Presidential Election, Winning Candidates, by County, United States (Pierce [Democratic]=purple; Scott [Whig]=aqua)
- 1856 Presidential Election, Winning Candidates, by County, Mid-Atlantic Region (Buchanan [Democratic]=purple; Fremont [Republican]=aqua; Fillmore [American]=green)
- 1856 Presidential Election, Winning Candidates, by County, United States (Buchanan [Democratic]=purple; Fremont [Republican]=aqua; Fillmore [American]=green)
- Percent of Votes for Republican Party Candidate John C. Fremont, Mid-Atlantic Region, 1856 Presidential Election
- Percent of Votes for Republican Party Candidate John C. Fremont, United States, 1856 Presidential Election
- 1860 Presidential Election Results, Winning Candidate, By County, Mid-Atlantic Region (Lincoln [Republican]=purple; Douglas [Democratic] and Breckenridge [Democratic Equivalent]=Aqua; Bell [Constitutional Union]=Green)
- 1860 Presidential Election Results, Winning Candidate, By County, United States (Lincoln [Republican]=purple; Douglas [Democratic] and Breckenridge [Democratic Equivalent]=Aqua; Bell [Constitutional Union]=Green)
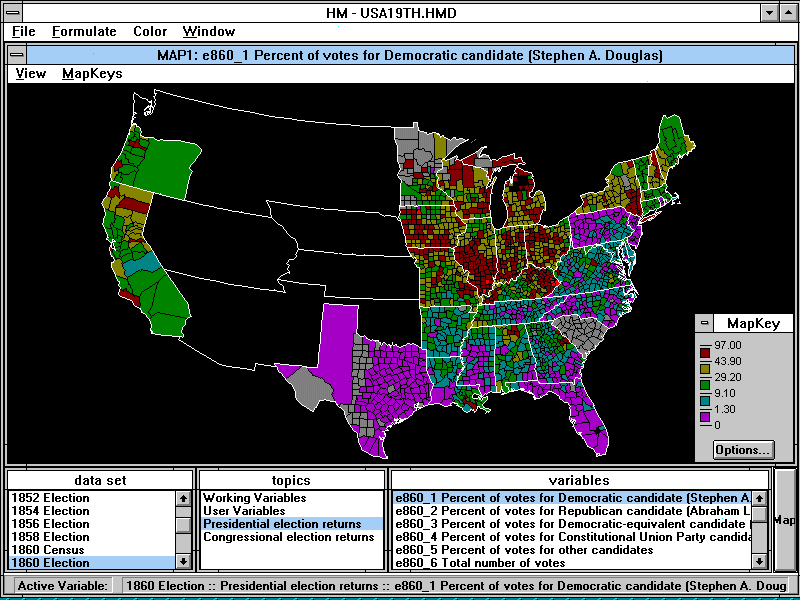
- Percent of Votes for Democratic Party Candidate Stephen A. Douglas, Mid-Atlantic Region, 1860 Presidential Election
- Percent of Votes for Democratic Party Candidate Stephen A. Douglas, United States, 1860 Presidential Election
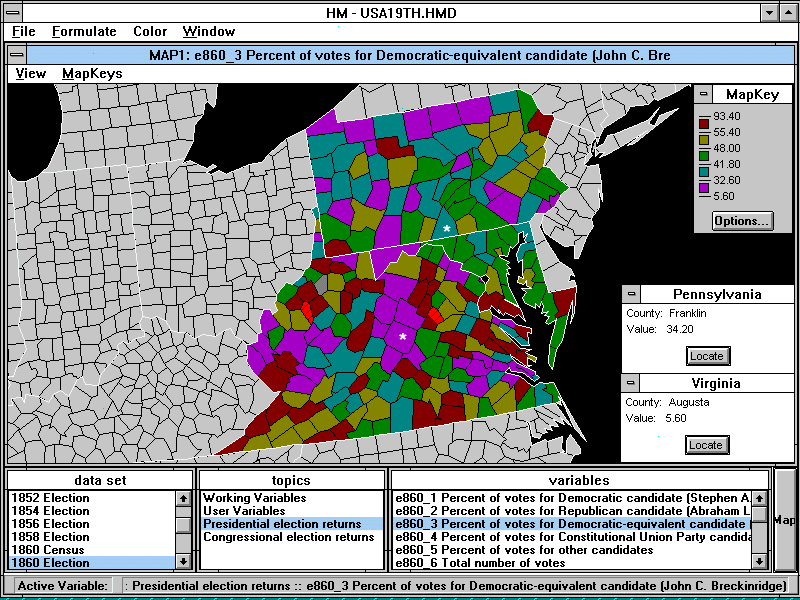
- Percent of Votes for Southern Democratic Party Candidate John C. Breckenridge, Mid-Atlantic Region1860 Presidential Election
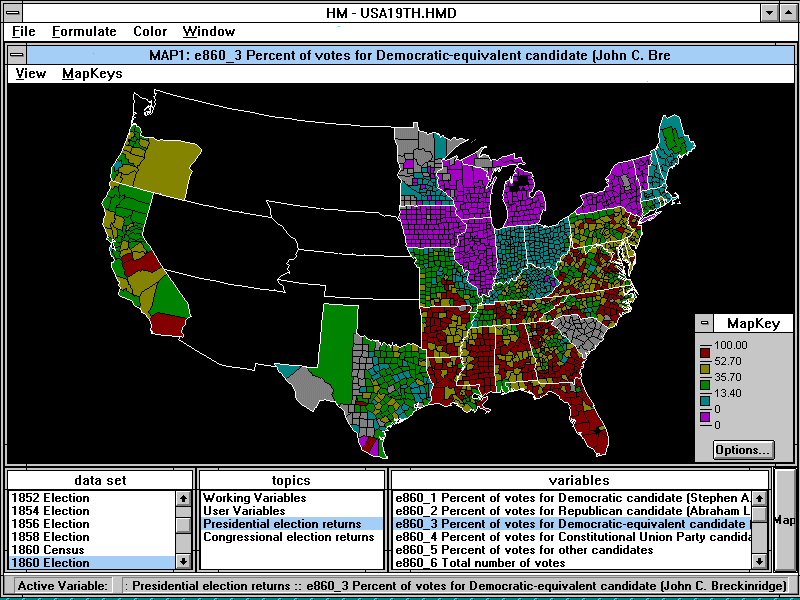
- Percent of Votes for Southern Democratic Party Candidate John C. Breckenridge, United States, 1860 Presidential Election
|
![1852 Presidential Election, Winning Candidates, by County, Mid-Atlantic Region (Pierce [Democratic]=purple; Scott [Whig]=aqua)](maps/1852pres.gif)
![1852 Presidential Election, Winning Candidates, by County, United States (Pierce [Democratic]=purple; Scott [Whig]=aqua)](maps/1852elec.gif)
![1856 Presidential Election, Winning Candidates, by County, Mid-Atlantic Region (Buchanan [Democratic]=purple; Fremont [Republican]=aqua; Fillmore [American]=green)](maps/1856pres.gif)
![1860 Presidential Election Results, Winning Candidate, By County, Mid-Atlantic Region (Lincoln [Republican]=purple; Douglas [Democratic] and Breckenridge [Democratic Equivalent]=Aqua; Bell [Constitutional Union]=Green)](maps/1860vote.gif)
![1860 Presidential Election Results, Winning Candidate, By County, United States (Lincoln [Republican]=purple; Douglas [Democratic] and Breckenridge [Democratic Equivalent]=Aqua; Bell [Constitutional Union]=Green)](maps/1860elec.gif)